slo: Turn latency budgets into a capacity number
Why this mode exists
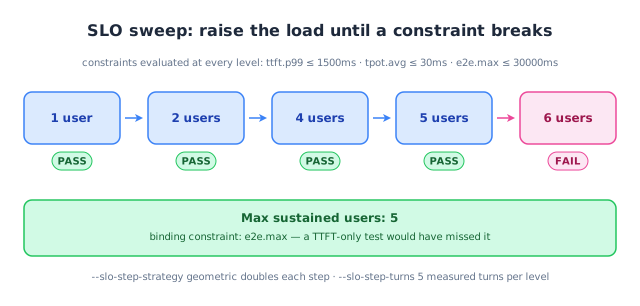
“How many users can this box serve?” is the question every capacity plan needs, and it is not answered by a single load level. This mode raises concurrency step by step, evaluates every constraint at each level, and stops at the first one that breaks — naming which constraint broke it.
How to run it
bash
clawperf --mode slo \
  --endpoint http://localhost:8000/v1 --model Qwen3-0.6B \
  --tokenizer /mnt/model/Qwen3-0.6B \
  --slo ttft.p99:1500 --slo tpot.avg:30 --slo e2e.max:30000 \
  --slo-min-users 1 --slo-max-users 200 --slo-step-strategy geometric \
  --slo-step-turns 5 --slo-error-rate 0.01 \
  --output results_slo.json
Parameters that matter
| Option | What it does |
|---|---|
--slo |
Repeatable constraint <metric>.<agg><sep><ms>; all constraints AND together. |
--slo-min-users |
Lowest concurrency level the sweep starts from. |
--slo-max-users |
Highest level the sweep may reach. |
--slo-step-strategy |
geometric doubles each step; linear walks one level at a time. |
--slo-step-turns |
Measured turns per user at each level (plus --slo-step-warmup-turns). |
--slo-error-rate |
Extra pass condition on the error fraction. |
--slo-step-timeout-s |
Wall-clock budget per level; an overrun counts as TIMEOUT and fails. |
The full list, with defaults, is in the reference.
Real output
Real vLLM-Ascend 910B3 SLO sweep (Qwen3-0.6B, 32K window).
clawperf report results_e2e/slo.json --print
Report saved to: results_e2e/slo.md
# ClawPerf Benchmark Report
| Field | Value |
| Model | `qwen3` |
| Endpoint | `http://110.138.0.3:9155/v1` |
| Backend | vllm |
| Mode | `slo` |
| SLO | ttft.p99<=1500ms, tpot.avg<=30ms, e2e.max<=20000ms |
| Max Users | 5 |
| Setup Time | 34.69s |
| Bench Time | 394.06s |
## Verdict: ✅ GOOD
- **Max sustained users:** 5
## Key Findings
- Max sustained users meeting SLO: 5
- SLO criteria: ttft.p99<=1500ms, tpot.avg<=30ms, e2e.max<=20000ms
## Summary
| Users | ttft.p99 | tpot.avg | e2e.max | Error | SLO |
| 1 | 228ms | 9ms | 8888ms | 0.0% | ✅ |
| 2 | 259ms | 9ms | 9090ms | 0.0% | ✅ |
| 4 | 624ms | 15ms | 15.5s | 0.0% | ✅ |
| 5 | 768ms | 15ms | 16.0s | 0.0% | ✅ |
| 6 | 945ms | 21ms | 22.4s | 0.0% | ❌ |
| 8 | 822ms | 25ms | 26.6s | 0.0% | ❌ |
## Methodology
<details>
<summary>Click to expand</summary>
- **TTFT** (Time to First Token): wall time from request send to first content chunk on the wire.
- **TPOT** (Time Per Output Token): decode time / output tokens, excluding prefill.
- **ITL** (Inter-Token Latency): gap between consecutive output chunks.
- **Prefix cache hit rate**: token-level, read from the backend's Prometheus counters (start/end delta). Not
  request-level.
- **Verdict thresholds**: TTFT GOOD ≤3s / OK ≤10s; throughput GOOD ≥30 tok/s / OK ≥15 tok/s.
- **Compaction**: when context exceeds ``max_context_tokens``, history is cleared and the user prefix is incremented.
- **Decode throughput** isolates generation speed from prefill (excludes TTFT).
- **Wall-clock per-user throughput** uses real start/end timestamps, not summed per-request latencies.
</details>
How to read it
- One column per constraint — the report never hides a constraint you asked for.
- Max sustained users is the number to quote; the next level up is where it breaks.
- Look at which column turned red: capacity is usually bound by
e2e.maxlong before TTFT suffers. - TIMEOUT rows mean the level could not finish inside
--slo-step-timeout-s— raise it for very long contexts.
Other modes: scenario · hitrate · agent · trace · record & replay