scenario: The core agentic-load simulator
Why this mode exists
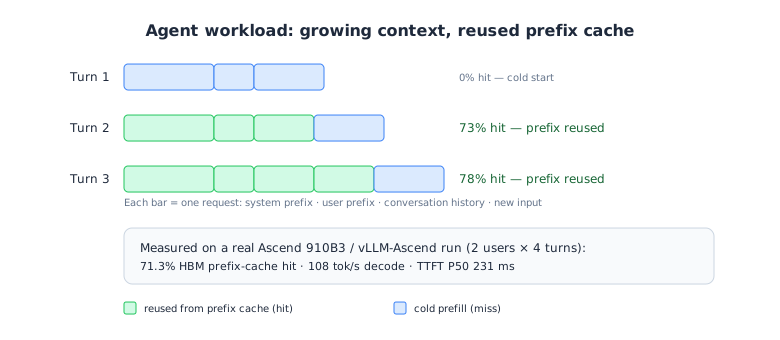
A coding agent does not send one prompt — it grows a conversation, reuses the same system prefix every turn, and several sessions run at once. A single-shot benchmark cannot see the prefill that accumulates turn by turn, so it reports a TTFT your users will never get. This mode models the conversation.
How to run it
bash
clawperf --mode scenario \
  --endpoint http://localhost:8000/v1 --model Qwen3-0.6B \
  --tokenizer /mnt/model/Qwen3-0.6B \
  --context-profile medium \
  --num-users 8 --max-turns 20 --user-arrival poisson:2 \
  --metrics-endpoint http://localhost:8000/metrics --reset-cache \
  --output results_scenario.json
Parameters that matter
| Option | What it does |
|---|---|
--context-profile |
Named context size: fresh 7K → xxl 392K. Sets the system prefix, per-user prefix and per-turn input at once. |
--num-users |
Concurrent sessions. |
--max-turns |
Turns per session; history accumulates across them. |
--user-arrival |
When sessions join: burst, steady:<s>, poisson:<lambda>. |
--max-context-tokens |
Where append-mode compaction triggers — set it to the model's real window. |
--suite |
Sweep several (users × profile) combinations in one command. |
The full list, with defaults, is in the reference.
Real output
Real multi-turn long-context run on the same box.
clawperf report results_e2e/scenario.json --print
1 user(s) | ███████████████████████████░░░ 221ms
2 user(s) | ██████████████████████████████ 240ms
Report saved to: results_e2e/scenario.md
# ClawPerf Benchmark Report
| Field | Value |
| Model | `qwen3` |
| Endpoint | `http://110.138.0.3:9155/v1` |
| Backend | vllm |
| Mode | `scenario` |
| Users | 2 |
| Max Turns | 4 |
| Context | sys=4000 + usr=1500 + in=1500 tokens |
| Setup Time | 37.23s |
| Bench Time | 40.33s |
## Verdict: ✅ GOOD
- **TTFT (P50):** 221ms — instant (GOOD)
- **Decode throughput:** 99.5 tok/s — smooth (GOOD)
## Key Findings
- Per-user decode throughput ranges 99.4–99.5 tok/s
- Concurrency efficiency: 50% (max_thru / (min_thru × N))
- P50 TTFT: 221ms — instant
## Summary
| User | In Tok | Out Tok | TTFT P50 | TPOT P50 | E2E P50 | tok/s | Comp | Succ | Fail |
| 0 | 40,589 | 4,000 | 221ms | 9.25ms | 9460ms | 99.5 | 0 | 4 | 0 |
| 1 | 41,313 | 4,000 | 240ms | 9.23ms | 9453ms | 99.4 | 0 | 4 | 0 |
## TTFT Scaling (P50)
## Concurrency Scaling
| Users | Total tok/s | Per-user tok/s | Efficiency |
| 1 | 99.5 | 99.5 | 100% |
| 2 | 198.8 | 99.4 | 100% |
## Methodology
<details>
<summary>Click to expand</summary>
- **TTFT** (Time to First Token): wall time from request send to first content chunk on the wire.
- **TPOT** (Time Per Output Token): decode time / output tokens, excluding prefill.
- **ITL** (Inter-Token Latency): gap between consecutive output chunks.
- **Prefix cache hit rate**: token-level, read from the backend's Prometheus counters (start/end delta). Not
  request-level.
- **Verdict thresholds**: TTFT GOOD ≤3s / OK ≤10s; throughput GOOD ≥30 tok/s / OK ≥15 tok/s.
- **Compaction**: when context exceeds ``max_context_tokens``, history is cleared and the user prefix is incremented.
- **Decode throughput** isolates generation speed from prefill (excludes TTFT).
- **Wall-clock per-user throughput** uses real start/end timestamps, not summed per-request latencies.
</details>
How to read it
- TTFT should grow with context: compare the first turns with the last ones.
- Decode throughput shows whether batching still holds up as sessions multiply.
- Compactions above zero means a session hit the window and its history was folded — expected on long runs, not an error.
- Failed requests must stay at zero; a single 400 usually means the context no longer fits.
Other modes: hitrate · slo · agent · trace · record & replay