description: ClawPerf benchmarks LLM serving under real agent workloads: seven modes, one CLI.
ClawPerf
Benchmark LLM serving under real agent workloads — multi-turn, long-context, prefix-cache-heavy traffic. Seven modes, one CLI, built on EvalScope.
- 7 modes — each answers a different question; the cards below map them.
- 4 backends — vLLM · SGLang · MindIE · vllm-ascend, with per-backend metric mapping.
- amd64 + arm64 — native multi-arch images, plus a mock server so CI needs no GPU.
Quick start Full reference GitHub
First run
The default mode is scenario: N users holding independent conversations that grow turn by turn. Point --tokenizer at a local directory — it is loaded strictly offline.
clawperf --mode scenario \
  --endpoint http://localhost:8000/v1 --model Qwen3-0.6B \
  --tokenizer /mnt/model/Qwen3-0.6B \
  --context-profile medium --num-users 8 --max-turns 20 \
  --metrics-endpoint http://localhost:8000/metrics \
  --output results.json
Pick the question you need answered
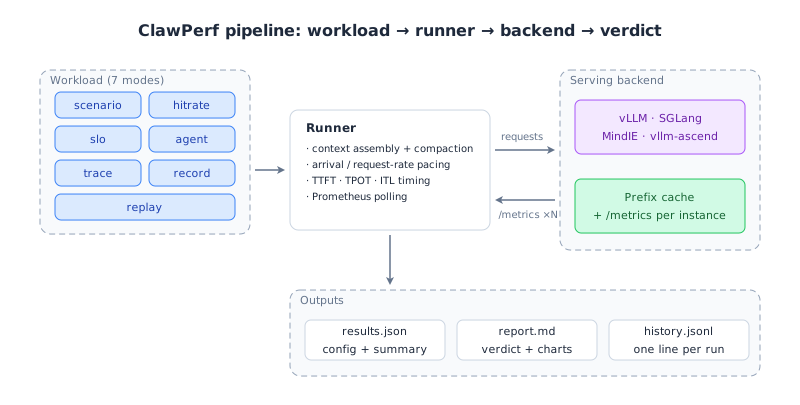
Every mode writes a JSON result plus a Markdown report with a verdict. Each one has its own page: why it exists, a diagram, the command, the parameters and a real run.
One runner, seven workloads
Measured, not claimed
From the end-to-end run in docs/E2E_TEST_REPORT.md: vLLM-Ascend v0.23.0, Qwen3-0.6B, one Ascend 910B3.
-
Hit rate is verifiable
49.90% measured against a 50.00% target — 40 requests, 2 distinct prefixes, concurrency 4.
-
Real traces reuse a lot
90.42% prefix-reuse ceiling over 34 real Claude Code requests; replay of the fitting requests succeeded 29/29.
-
Capacity is a number
5 users sustained under
ttft.p99<=1500ms,tpot.avg<=30ms,e2e.max<=20s.
A real SLO sweep on real hardware
Real vLLM-Ascend 910B3 SLO sweep (Qwen3-0.6B, 32K window).
Report saved to: results_e2e/slo.md
# ClawPerf Benchmark Report
| Field | Value |
| Model | `qwen3` |
| Endpoint | `http://110.138.0.3:9155/v1` |
| Backend | vllm |
| Mode | `slo` |
| SLO | ttft.p99<=1500ms, tpot.avg<=30ms, e2e.max<=20000ms |
| Max Users | 5 |
| Setup Time | 34.69s |
| Bench Time | 394.06s |
## Verdict: ✅ GOOD
- **Max sustained users:** 5
## Key Findings
- Max sustained users meeting SLO: 5
- SLO criteria: ttft.p99<=1500ms, tpot.avg<=30ms, e2e.max<=20000ms
## Summary
| Users | ttft.p99 | tpot.avg | e2e.max | Error | SLO |
| 1 | 228ms | 9ms | 8888ms | 0.0% | ✅ |
| 2 | 259ms | 9ms | 9090ms | 0.0% | ✅ |
| 4 | 624ms | 15ms | 15.5s | 0.0% | ✅ |
| 5 | 768ms | 15ms | 16.0s | 0.0% | ✅ |
| 6 | 945ms | 21ms | 22.4s | 0.0% | ❌ |
| 8 | 822ms | 25ms | 26.6s | 0.0% | ❌ |
## Methodology
<details>
<summary>Click to expand</summary>
- **TTFT** (Time to First Token): wall time from request send to first content chunk on the wire.
- **TPOT** (Time Per Output Token): decode time / output tokens, excluding prefill.
- **ITL** (Inter-Token Latency): gap between consecutive output chunks.
- **Prefix cache hit rate**: token-level, read from the backend's Prometheus counters (start/end delta). Not
  request-level.
- **Verdict thresholds**: TTFT GOOD ≤3s / OK ≤10s; throughput GOOD ≥30 tok/s / OK ≥15 tok/s.
- **Compaction**: when context exceeds ``max_context_tokens``, history is cleared and the user prefix is incremented.
- **Decode throughput** isolates generation speed from prefill (excludes TTFT).
- **Wall-clock per-user throughput** uses real start/end timestamps, not summed per-request latencies.
</details>