record & replay: Capture once, replay anywhere
Why this mode exists
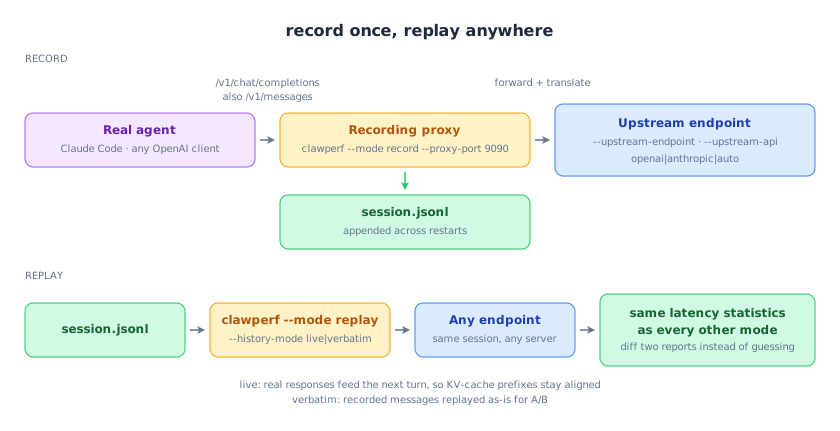
The most convincing benchmark is your own session. Point a real agent (Claude Code, any OpenAI or Anthropic client) at the recording proxy while you work; afterwards you can replay that exact session against any endpoint — before and after a config change, or between two vendors — with the KV-cache prefix aligned the way it was live.
How to run it
bash
# terminal 1 — record (accepts /v1/chat/completions and /v1/messages)
clawperf --mode record --proxy-port 9090 \
  --upstream-endpoint https://api.example.com/v1 --upstream-api openai \
  --recording session.jsonl
# ... point your agent at http://localhost:9090/v1, work, then Ctrl+C

# terminal 2 — replay it against any endpoint
clawperf --mode replay --recording session.jsonl \
  --endpoint http://localhost:8000/v1 --model Qwen3-0.6B \
  --tokenizer /mnt/model/Qwen3-0.6B \
  --history-mode live --concurrency 4 \
  --output results_replay.json
Parameters that matter
| Option | What it does |
|---|---|
--recording |
The JSONL file to write (record) or read (replay). Appends across restarts and tells you what it kept. |
--upstream-endpoint |
Where the proxy forwards to. |
--upstream-api |
openai, anthropic or auto — Anthropic is translated on the fly. |
--history-mode |
live feeds real responses into the next turn (prefix-aligned); verbatim replays recorded messages as-is for A/B. |
--concurrency |
In-flight requests during replay. |
The full list, with defaults, is in the reference.
Real output
A recorded agent session replayed with live history.
clawperf report results_e2e/replay.json --print
Report saved to: results_e2e/replay.md
# ClawPerf Benchmark Report
| Field | Value |
| Model | `qwen3` |
| Endpoint | `http://110.138.0.3:9155/v1` |
| Backend | vllm |
| Mode | `replay` |
| Setup Time | 0.00s |
| Bench Time | 93.84s |
## Verdict: ❌ POOR
## Methodology
<details>
<summary>Click to expand</summary>
- **TTFT** (Time to First Token): wall time from request send to first content chunk on the wire.
- **TPOT** (Time Per Output Token): decode time / output tokens, excluding prefill.
- **ITL** (Inter-Token Latency): gap between consecutive output chunks.
- **Prefix cache hit rate**: token-level, read from the backend's Prometheus counters (start/end delta). Not
  request-level.
- **Verdict thresholds**: TTFT GOOD ≤3s / OK ≤10s; throughput GOOD ≥30 tok/s / OK ≥15 tok/s.
- **Compaction**: when context exceeds ``max_context_tokens``, history is cleared and the user prefix is incremented.
- **Decode throughput** isolates generation speed from prefill (excludes TTFT).
- **Wall-clock per-user throughput** uses real start/end timestamps, not summed per-request latencies.
</details>
How to read it
- live is what you want for capacity work: the server's own responses become the next turn's history, so the prefixes line up exactly as they did in production.
- Use verbatim when comparing two servers on identical input — same bytes, different server.
- The verdict uses the same thresholds as every other mode, so two reports diff cleanly.