record & replay: 录一次,随处回放
为什么做这个模式
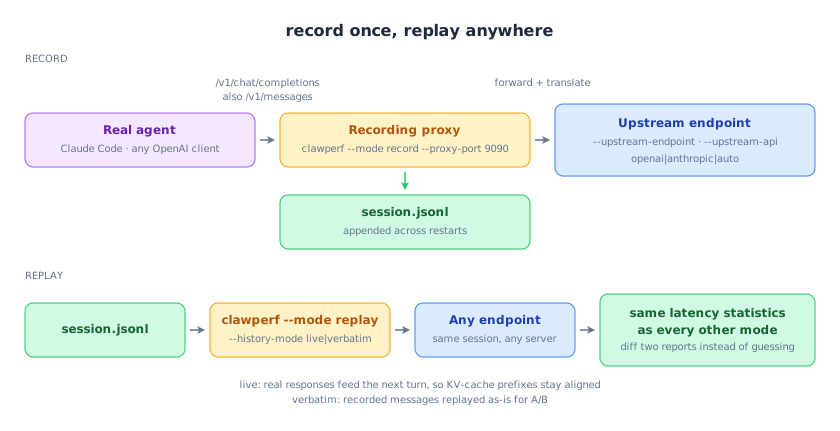
最有说服力的基准就是你自己的会话。工作时把真实 Agent(Claude Code 或任意 OpenAI/Anthropic 客户端)指向录制代理,之后就能把这段会话原样回放到任意端点 —— 改配置前后对比、两家供应商对比 —— 并且 KV 缓存前缀与当时一致。
怎么用
bash
# terminal 1 — record (accepts /v1/chat/completions and /v1/messages)
clawperf --mode record --proxy-port 9090 \
  --upstream-endpoint https://api.example.com/v1 --upstream-api openai \
  --recording session.jsonl
# ... point your agent at http://localhost:9090/v1, work, then Ctrl+C

# terminal 2 — replay it against any endpoint
clawperf --mode replay --recording session.jsonl \
  --endpoint http://localhost:8000/v1 --model Qwen3-0.6B \
  --tokenizer /mnt/model/Qwen3-0.6B \
  --history-mode live --concurrency 4 \
  --output results_replay.json
关键参数
| 参数 | 作用 |
|---|---|
--recording |
写入(record)或读取(replay)的 JSONL 文件;跨重启追加,并提示保留了多少历史。 |
--upstream-endpoint |
代理转发到哪里。 |
--upstream-api |
openai、anthropic 或 auto —— Anthropic 会被实时翻译。 |
--history-mode |
live 把真实返回作为下一轮历史(前缀对齐);verbatim 原样回放录制内容,适合 A/B。 |
--concurrency |
回放时的在途请求数。 |
完整参数列表(含默认值)见完整参考。
真实输出
按 live 历史回放的录制会话。
clawperf report results_e2e/replay.json --print
Report saved to: results_e2e/replay.md
# ClawPerf Benchmark Report
| Field | Value |
| Model | `qwen3` |
| Endpoint | `http://110.138.0.3:9155/v1` |
| Backend | vllm |
| Mode | `replay` |
| Setup Time | 0.00s |
| Bench Time | 93.84s |
## Verdict: ❌ POOR
## Methodology
<details>
<summary>Click to expand</summary>
- **TTFT** (Time to First Token): wall time from request send to first content chunk on the wire.
- **TPOT** (Time Per Output Token): decode time / output tokens, excluding prefill.
- **ITL** (Inter-Token Latency): gap between consecutive output chunks.
- **Prefix cache hit rate**: token-level, read from the backend's Prometheus counters (start/end delta). Not
  request-level.
- **Verdict thresholds**: TTFT GOOD ≤3s / OK ≤10s; throughput GOOD ≥30 tok/s / OK ≥15 tok/s.
- **Compaction**: when context exceeds ``max_context_tokens``, history is cleared and the user prefix is incremented.
- **Decode throughput** isolates generation speed from prefill (excludes TTFT).
- **Wall-clock per-user throughput** uses real start/end timestamps, not summed per-request latencies.
</details>
怎么读结果
- 做容量评估要用 live:服务端真实返回成为下一轮历史,前缀与生产环境完全一致。
- 比较两台服务端处理同样输入时用 verbatim —— 同样的字节,不同的服务端。
- 结论阈值与其他模式一致,因此两份报告可以直接对比。