hitrate: 前缀缓存到底有没有生效?
为什么做这个模式
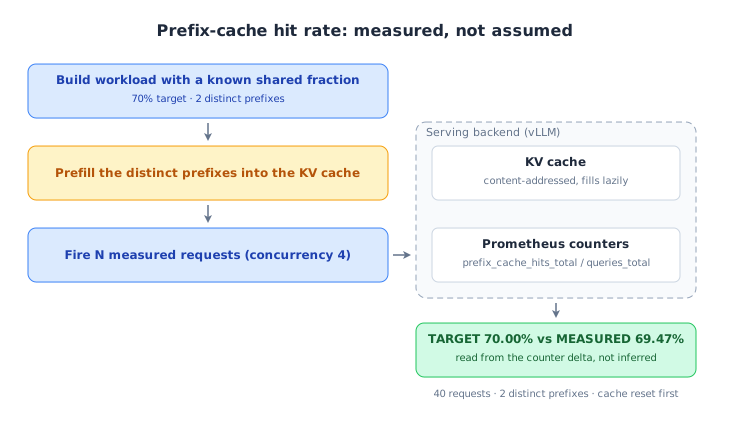
前缀缓存是 Agent 时延上最大的一根杠杆,但通常只是「假设生效」而没有被测量。这个模式构造一个已知共享比例的负载,先预填充,再从服务端自己的 Prometheus 计数器读出真实命中率 —— 于是「我们开了前缀缓存」变成一个可以写进评审的数字。
怎么用
clawperf --mode hitrate \
  --endpoint http://localhost:8000/v1 --model Qwen3-0.6B \
  --tokenizer /mnt/model/Qwen3-0.6B \
  --num-requests 200 --input-len 8192 --hit-rate 0.7 --prefix-num 4 \
  --output-len 128 --concurrency 8 \
  --metrics-endpoint http://localhost:8000/metrics --reset-cache \
  --output results_hitrate.json
关键参数
| 参数 | 作用 |
|---|---|
--hit-rate |
目标共享比例 0..1,用于反推前缀长度;与 --prefix-len 互斥。 |
--input-len |
提示词总长度 = 共享前缀 + 边界 + 各自独有的后缀。 |
--prefix-num |
有多少个不同前缀 —— 这正是多租户感的来源。 |
--num-requests |
测量阶段的请求数。 |
--no-prefill |
跳过预填充阶段,测冷缓存表现。 |
--reset-cache |
先清空缓存,避免残余流量抬高结果。 |
完整参数列表(含默认值)见完整参考。
真实输出
真实的前缀缓存命中率测量。
Report saved to: results_e2e/hitrate.md
# ClawPerf Benchmark Report
| Field | Value |
| Model | `qwen3` |
| Endpoint | `http://110.138.0.3:9155/v1` |
| Backend | vllm |
| Mode | `hitrate` |
| Input Len | 4096 |
| Prefix Len | 2048 |
| Concurrency | 4 |
| Setup Time | 10.09s |
| Bench Time | 5.19s |
## Verdict: ✅ GOOD
- **TTFT (P50):** 214ms — instant (GOOD)
- **Measured hit rate:** 49.90% (target: 50.00%)
## Key Findings
- Target hit rate: 50.0%  |  Measured: 49.9%
- P50 TTFT: 214ms — instant
## Summary
| Metric | Value |
| Requests | 40 |
| Success | 40 |
| Errors | 0 |
| Target Hit Rate | 50.0% |
| Measured Hit Rate | 49.90%
| ttft P50 | 214ms |
| e2e_latency P50 | 482ms |
| tpot P50 | 9ms |
## Methodology
<details>
<summary>Click to expand</summary>
- **TTFT** (Time to First Token): wall time from request send to first content chunk on the wire.
- **TPOT** (Time Per Output Token): decode time / output tokens, excluding prefill.
- **ITL** (Inter-Token Latency): gap between consecutive output chunks.
- **Prefix cache hit rate**: token-level, read from the backend's Prometheus counters (start/end delta). Not
  request-level.
- **Verdict thresholds**: TTFT GOOD ≤3s / OK ≤10s; throughput GOOD ≥30 tok/s / OK ≥15 tok/s.
- **Compaction**: when context exceeds ``max_context_tokens``, history is cleared and the user prefix is incremented.
- **Decode throughput** isolates generation speed from prefill (excludes TTFT).
- **Wall-clock per-user throughput** uses real start/end timestamps, not summed per-request latencies.
</details>
hitrate 模式全流程。
console title="clawperf --mode hitrate --endpoint http://127.0.0.1:18095/v1/chat/completions --model \
    qwen3-0.6b --tokenizer tokenizers/qwen3-0.6b --num-requests 60 --input-len 4096 \
    --output-len 32 --hit-rate 0.7 --prefix-num 2 --concurrency 4 --metrics-endpoint \
    http://127.0.0.1:18095/metrics --reset-cache --output results.json"
======================================================================
ClawPerf - LLM Serving Performance Benchmark
  (Powered by EvalScope perf infrastructure)
======================================================================
  Model:        qwen3-0.6b
  Endpoint:     http://127.0.0.1:18095/v1/chat/completions
  Backend:      vllm
  Users:        1 (arrival: burst)
  Max Turns:    100
  Context:      sys=15000, usr=5000, in=5000, out=1000
  Max Context:  128000 tokens
  Ignore EOS:   True
  Tokenizer:    D:\Project\ClawPerf\tokenizers\qwen3-0.6b
  Metrics:      http://127.0.0.1:18095/metrics
  History:      clawperf_history.jsonl (append)
======================================================================
INFO:clawperf:Loaded local tokenizer from D:\Project\ClawPerf\tokenizers\qwen3-0.6b [local dir (transformers)] —
  vocab=151669, chat_template=yes
INFO:clawperf:Pre-flight check: probing http://127.0.0.1:18095/v1/chat/completions ...
INFO:clawperf:Pre-flight check OK (attempt 1/3).
INFO:clawperf:Hit-rate test: 60 requests, input=4096, prefix=2867 (target 70.0%), 2 distinct prefixes, output=32,
  concurrency=4
WARNING:clawperf:Prefix cache reset endpoint http://127.0.0.1:18095/reset_prefix_cache not found (404) — this backend
  doesn't expose cache reset. Continuing without a clean baseline; measured hit rate may include residual prefixes.
INFO:clawperf:Setup complete in 11.22s — starting hit-rate test
INFO:clawperf:Prefill: injecting 2 distinct prefixes ...
INFO:clawperf:Metrics start (post-prefill): query=191,842 hit=141,439 ext_query=15,655 ext_hit=0 engines=['0']
  ext_engines=['0']
INFO:clawperf:Measure: sending 60 requests ...
HitRate: 100%|██████████| 60/60 [00:00<00:00, 66.44req/s]
INFO:clawperf:Metrics end: query=491,478 hit=351,199 ext_query=15,655 ext_hit=0 engines=['0'] ext_engines=['0']
INFO:clawperf:History appended to: clawperf_history.jsonl
INFO:clawperf:Markdown report saved to: C:\Users\keriko\AppData\Local\Temp\sample_hitrate.md
======================================================================
ClawPerf - Hit-Rate Test Complete
======================================================================
  Hit-Rate Results
+-------------------------+---------------+
| Metric                  |         Value |
+-------------------------+---------------+
| Setup Time              |       11.22 s |
| Duration                |        0.95 s |
| Total Requests          |            60 |
| Success Requests        |            60 |
| Failed Requests         |             0 |
| Input Length            |   4096 tokens |
| Prefix Length           |   2867 tokens |
| Distinct Prefixes       |             2 |
| Output Length           |     32 tokens |
| Concurrency             |             4 |
| Total Input Tokens      |       245,760 |
| Total Output Tokens     |         1,920 |
| Output Token Throughput | 2014.69 tok/s |
| TARGET Hit Rate         |        70.00% |
| MEASURED Hit Rate       |        70.00% |
| HBM Hit Tokens          |       209,760 |
| HBM Query Tokens        |       299,636 |
+-------------------------+---------------+
怎么读结果
- 目标 vs 实测是核心结论:两者应在一两个点以内。差距过大说明提示词的共享方式与你的预期不符。
- 加速比才是真正的收益 —— 理论上限是
1/(1-命中率),报告会同时给出两者。 - 逐引擎行说明复用发生在哪个实例;PD 部署中通常是 prefill 实例。
其他模式: scenario · slo · agent · trace · record & replay