slo: 把时延预算变成容量数字
为什么做这个模式
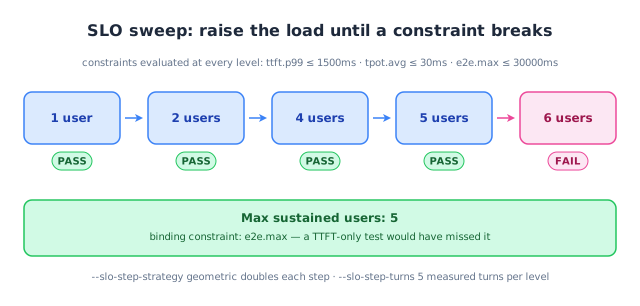
「这台机器能支撑多少用户」是每个容量规划都要回答的问题,而单个负载档位答不了。这个模式逐级提高并发,在每一级评估全部约束,并在第一个被打破的档位停下 —— 并指出是哪条约束先破的。
怎么用
bash
clawperf --mode slo \
  --endpoint http://localhost:8000/v1 --model Qwen3-0.6B \
  --tokenizer /mnt/model/Qwen3-0.6B \
  --slo ttft.p99:1500 --slo tpot.avg:30 --slo e2e.max:30000 \
  --slo-min-users 1 --slo-max-users 200 --slo-step-strategy geometric \
  --slo-step-turns 5 --slo-error-rate 0.01 \
  --output results_slo.json
关键参数
| 参数 | 作用 |
|---|---|
--slo |
可重复的约束 <指标>.<统计量><分隔符><毫秒>;多条之间为「与」关系。 |
--slo-min-users |
扫描的起始并发用户数。 |
--slo-max-users |
扫描可达到的最大并发用户数。 |
--slo-step-strategy |
geometric 每步翻倍;linear 逐级递增。 |
--slo-step-turns |
每一级每个用户参与测量的轮数(另有 --slo-step-warmup-turns 预热轮)。 |
--slo-error-rate |
额外的错误率达标条件。 |
--slo-step-timeout-s |
每级的墙钟预算;超时记为 TIMEOUT 并判定不达标。 |
完整参数列表(含默认值)见完整参考。
真实输出
真机 vLLM-Ascend 910B3 SLO 扫描(Qwen3-0.6B,32K 窗口)。
clawperf report results_e2e/slo.json --print
Report saved to: results_e2e/slo.md
# ClawPerf Benchmark Report
| Field | Value |
| Model | `qwen3` |
| Endpoint | `http://110.138.0.3:9155/v1` |
| Backend | vllm |
| Mode | `slo` |
| SLO | ttft.p99<=1500ms, tpot.avg<=30ms, e2e.max<=20000ms |
| Max Users | 5 |
| Setup Time | 34.69s |
| Bench Time | 394.06s |
## Verdict: ✅ GOOD
- **Max sustained users:** 5
## Key Findings
- Max sustained users meeting SLO: 5
- SLO criteria: ttft.p99<=1500ms, tpot.avg<=30ms, e2e.max<=20000ms
## Summary
| Users | ttft.p99 | tpot.avg | e2e.max | Error | SLO |
| 1 | 228ms | 9ms | 8888ms | 0.0% | ✅ |
| 2 | 259ms | 9ms | 9090ms | 0.0% | ✅ |
| 4 | 624ms | 15ms | 15.5s | 0.0% | ✅ |
| 5 | 768ms | 15ms | 16.0s | 0.0% | ✅ |
| 6 | 945ms | 21ms | 22.4s | 0.0% | ❌ |
| 8 | 822ms | 25ms | 26.6s | 0.0% | ❌ |
## Methodology
<details>
<summary>Click to expand</summary>
- **TTFT** (Time to First Token): wall time from request send to first content chunk on the wire.
- **TPOT** (Time Per Output Token): decode time / output tokens, excluding prefill.
- **ITL** (Inter-Token Latency): gap between consecutive output chunks.
- **Prefix cache hit rate**: token-level, read from the backend's Prometheus counters (start/end delta). Not
  request-level.
- **Verdict thresholds**: TTFT GOOD ≤3s / OK ≤10s; throughput GOOD ≥30 tok/s / OK ≥15 tok/s.
- **Compaction**: when context exceeds ``max_context_tokens``, history is cleared and the user prefix is incremented.
- **Decode throughput** isolates generation speed from prefill (excludes TTFT).
- **Wall-clock per-user throughput** uses real start/end timestamps, not summed per-request latencies.
</details>
怎么读结果
- 每条约束一列 —— 报告不会隐藏你要求的任何一条约束。
- 最大可支撑用户数就是要引用的数字;再上一档就是它开始崩的地方。
- 注意哪一列变红:容量往往在 TTFT 变差之前很久就被
e2e.max卡住。 - TIMEOUT 行表示该档没能在
--slo-step-timeout-s内跑完 —— 超长上下文时可以调大。
其他模式: scenario · hitrate · agent · trace · record & replay