The knobs you will actually touch
Everything else — all parameters, their defaults and accepted values — is in the reference, generated from clawperf --help.
Context profiles
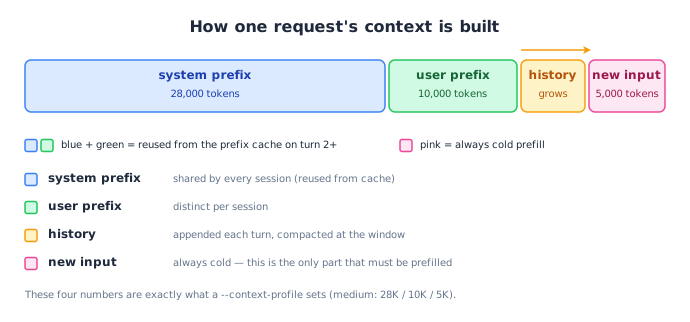
A profile sets the shared system prefix, the per-user prefix and the per-turn input at once, so you do not have to invent token counts. Names are case-insensitive.
| Profile | system prefix | user prefix | input / turn | base context | rounded |
|---|---|---|---|---|---|
fresh |
4,000 | 1,500 | 1,500 | 7,000 | ~7K |
short |
14,000 | 5,000 | 3,000 | 22,000 | ~22K |
medium |
28,000 | 10,000 | 5,000 | 43,000 | ~43K |
long |
50,000 | 18,000 | 7,000 | 75,000 | ~75K |
full |
72,000 | 25,000 | 8,000 | 105,000 | ~105K |
xl |
150,000 | 45,000 | 10,000 | 205,000 | ~205K |
xxl |
300,000 | 80,000 | 12,000 | 392,000 | ~392K |
Note
Raw counts still work: --system-prefix-tokens, --user-prefix-tokens, --input-tokens-per-turn. A profile simply overrides all three.
Suites
A suite runs several (users × profile) scenarios in sequence and writes one result file per scenario. --model-context-length skips profiles that cannot fit the model window.
| Suite | users | profiles | turns | out/turn | runs |
|---|---|---|---|---|---|
quick |
1, 4, 8 | fresh |
10 | 256 | 3 |
standard |
1, 8, 16, 32 | medium + long |
20 | 512 | 8 |
full |
1, 4, 8, 16, 32, 64 | fresh → short → medium → long → full |
30 | 512 | 30 |
hitrate |
1 | fresh → short → medium → long → full |
5 | 128 | 5 |
clawperf --mode scenario --context-profile medium --num-users 8 ...

# sweep profiles x users
clawperf --mode scenario --suite full --model-context-length 32768 ...
Pacing & concurrency
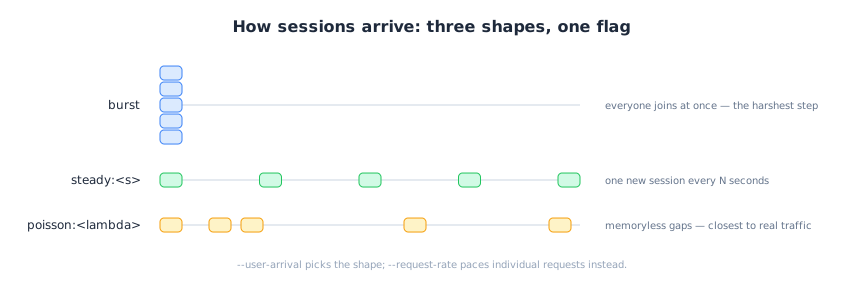
Four knobs that are easy to confuse. The distinction that matters: a closed loop can never overload a server, an open loop can.
| Knob | Controls | Semantics |
|---|---|---|
--user-arrival |
when each session joins | users then run their turns back-to-back |
--concurrency |
closed loop: in-flight request cap | the next request starts when one finishes — the server throttles the load |
--request-rate |
open loop: issue rate in req/s | released on a Poisson schedule regardless of completions — this one can overload a server |
--trace-users |
session-level concurrency for trace replay | turns inside one session stay ordered |
Metrics endpoints
PD-disaggregated and multi-replica services expose one /metrics per instance. Pass them all: counters are summed into a fleet-wide view, ratio gauges averaged, and the per-engine table gains one row per instance.
clawperf --mode scenario \
  --endpoint http://lb:9000/v1 --model Qwen3-0.6B \
  --tokenizer /mnt/model/Qwen3-0.6B \
  --metrics-endpoint prefill=http://10.0.0.1:9101/metrics \
  --metrics-endpoint decode=http://10.0.0.2:9102/metrics \
  --reset-cache
Tip
Labels are optional (name=url; the default is host:port) and the flag is repeatable or comma-separated. --reset-cache resets every instance.
Per-engine metric table from a live run
A live run: resolved config, pre-flight probe, progress, counters.
```console title="clawperf --mode hitrate --endpoint http://127.0.0.1:18095/v1/chat/completions --model \ qwen3-0.6b --tokenizer tokenizers/qwen3-0.6b --num-requests 60 --input-len 4096 \ --output-len 32 --hit-rate 0.7 --prefix-num 2 --concurrency 4 --metrics-endpoint \ http://127.0.0.1:18095/metrics --reset-cache --output results.json" HBM Prefix Cache (per engine) +----------+--------------+------------+----------+ | Engine | Query Tokens | Hit Tokens | Hit Rate | +----------+--------------+------------+----------+ | engine 0 | 299,636 | 209,760 | 70.00% | | TOTAL | 299,636 | 209,760 | 70.00% | +----------+--------------+------------+----------+ Performance Results +-------------+----------+----------+----------+----------+----------+----------+----------+----------+----+ | Metric | Avg | Min | P25 | P50 | P75 | P90 | P99 | Max | N | +-------------+----------+----------+----------+----------+----------+----------+----------+----------+----+ | TTFT | 55.27 ms | 27.45 ms | 57.15 ms | 57.81 ms | 58.40 ms | 58.96 ms | 59.55 ms | 59.62 ms | 60 | | E2E Latency | 59.08 ms | 28.34 ms | 61.06 ms | 61.68 ms | 62.00 ms | 62.80 ms | 63.59 ms | 63.89 ms | 60 | | TPOT | 0.12 ms | 0.03 ms | 0.12 ms | 0.12 ms | 0.13 ms | 0.14 ms | 0.15 ms | 0.15 ms | 60 | +-------------+----------+----------+----------+----------+----------+----------+----------+----------+----+ ====================================================================== INFO:clawperf:Results saved to: C:\Users\keriko\AppData\Local\Temp\sample_hitrate.json
## Env vars & config file

Precedence: **CLI > environment > YAML (`--config`) > defaults**. Every config field has a `CLAWPERF_*` counterpart, upper-cased. An explicitly passed flag always wins — even when its value equals the default.

| Variable | Equivalent to |
|---|---|
| `CLAWPERF_ENDPOINT` | `--endpoint` |
| `CLAWPERF_MODEL` | `--model` |
| `CLAWPERF_API_KEY` | `--api-key` |
| `CLAWPERF_OUTPUT` | `--output` |
| `CLAWPERF_HISTORY` | `--history` (`''` disables) |
| `CLAWPERF_UPSTREAM_ENDPOINT` | `--upstream-endpoint` |
| `CLAWPERF_TOKENIZER_BACKEND` | `transformers` \| `modelscope` |
| `CLAWPERF_<FIELD>` | any field: `CLAWPERF_NUM_USERS`, `CLAWPERF_CONTEXT_PROFILE`, … |

```yaml title="clawperf.yaml — CLI > env > YAML > defaults"
mode: scenario
endpoint: http://localhost:8000/v1
model: Qwen3-0.6B
tokenizer: /mnt/model/Qwen3-0.6B
context_profile: medium
num_users: 8
max_turns: 20
slo_constraints: ["ttft.p99<=1500", "tpot.avg<=30"]